
percent of Likely Voters (see data for only registered voters)
| Date | McCain | Obama | Other | Neither | Unsure |
| 11/02/2008 | 44% | 55% | <-- final estimate allocating undecided voters | ||
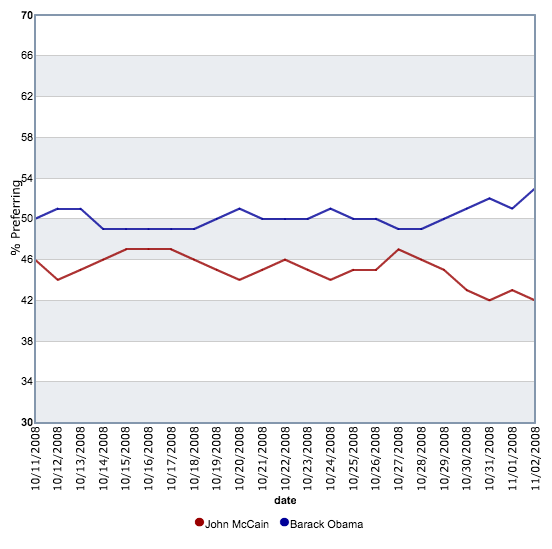
| 11/02/2008 | 42 | 53 | 1 | 1 | 3 |
| 11/01/2008 | 43 | 51 | 1 | 1 | 4 |
| 10/31/2008 | 42 | 52 | 1 | 1 | 4 |
| 10/30/2008 | 43 | 51 | 0 | 1 | 5 |
| 10/29/2008 | 45 | 50 | 0 | 1 | 4 |
| 10/28/2008 | 46 | 49 | 1 | 1 | 3 |
| 10/27/2008 | 47 | 49 | 1 | 1 | 3 |
| 10/26/2008 | 45 | 50 | 1 | 1 | 3 |
| 10/25/2008 | 45 | 50 | 1 | 1 | 3 |
| 10/24/2008 | 44 | 51 | 1 | 1 | 3 |
| 10/23/2008 | 45 | 50 | 1 | 1 | 3 |
| 10/22/2008 | 46 | 50 | 0 | 1 | 4 |
| 10/21/2008 | 45 | 50 | 0 | 1 | 4 |
| 10/20/2008 | 44 | 51 | 0 | 1 | 4 |
| 10/19/2008 | 45 | 50 | 0 | 1 | 4 |
| 10/18/2008 | 46 | 49 | 0 | 1 | 4 |
| 10/17/2008 | 47 | 49 | 0 | 1 | 2 |
| 10/16/2008 | 47 | 49 | 0 | 1 | 3 |
| 10/15/2008 | 47 | 49 | 1 | 1 | 3 |
| 10/14/2008 | 46 | 49 | 1 | 1 | 3 |
| 10/13/2008 | 45 | 51 | 1 | 1 | 3 |
| 10/12/2008 | 44 | 51 | 0 | 1 | 3 |
| 10/11/2008 | 46 | 50 | 0 | 1 | 3 |